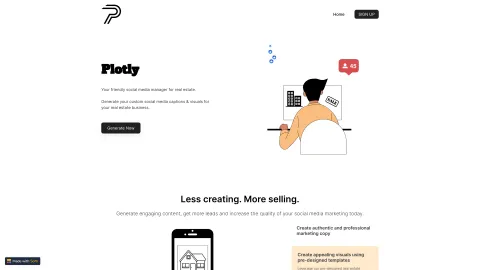
Plotly
Plotly empowers users to leverage interactive graphs and charts for data visualization, utilizing Python, JavaScript, and other tools for insightful analytics.
Tags: AI Graphic Design
Newsletter
AI Content Generator
AI Instagram Assistant
AI Social Media Assistant
AI Hashtag Assistant
Captions or Subtitle
Visit AI tool
What is Plotly?
Plotly is a cutting-edge data visualization library designed to create interactive, publication-quality graphs and charts tailored to various analytics needs. Built on top of d3.js and stack.gl, it supports a wide array of chart types, including 3D plots. With its versatile library implementations in Python, R, and JavaScript, it enables users, from developers to data scientists, to translate complex data into actionable insights effortlessly. The platform's rich graphical capabilities and intuitive design make it an essential tool for effective data presentation in research, business analyses, and various industries.
Who will use Plotly?
Developers
Data Scientists
Analysts
Researchers
Business Professionals
How to use the Plotly?
Step1: Install Plotly using pip or npm.
Step2: Import Plotly into your project.
Step3: Choose the appropriate chart type and input your data.
Step4: Customize your chart with labels, colors, and other options.
Step5: Render and review your interactive chart.
Step6: Share your chart or integrate it into your dashboards or applications.
Platform
web
The Core Features of Plotly
Interactive Charts
Multiple Chart Types
3D Plotting
Customizable Visualizations
Cross-Language Support
The Benefits of Plotly
Enhanced Data Insight
Ease of Use
Versatile Applications
Publication Ready Graphics
Community and Documentation Support
Plotly's Main Use Cases & Applications
Data Analytics
Business Intelligence
Academic Research
Machine Learning Models Evaluation
Real-Time Data Monitoring
FAQs of Plotly
What is Plotly?
Plotly is a library for creating interactive charts and graphs for data visualization.
Which programming languages are supported by Plotly?
Plotly supports Python, R, and JavaScript.
Can I create 3D plots with Plotly?
Yes, Plotly supports 3D plotting.
Is Plotly free to use?
Plotly offers both free and paid versions, with additional features available in the paid version.
How can I share my Plotly charts?
You can export your charts as HTML files or integrate them into web applications.
Is there community support available for Plotly?
Yes, Plotly has a strong community and extensive documentation.
Does Plotly integrate with web-based dashboards?
Yes, Plotly integrates seamlessly with web-based dashboards.
Can I customize the visual appearance of Plotly charts?
Yes, Plotly charts are highly customizable.
Do I need programming skills to use Plotly?
Basic programming skills in Python, R, or JavaScript are recommended.
What types of charts can I create with Plotly?
Plotly supports a wide range of charts including bar, line, scatter, and 3D plots.
AI Graphic Design
Newsletter
AI Content Generator
AI Instagram Assistant
AI Social Media Assistant
AI Hashtag Assistant
Captions or Subtitle
Contact: https://www.instagram.com/getplotly/
https://www.linkedin.com/company/plotjobsitecoordination